
The December 2015 issue of SIAM news has an article which I wrote as a follow up to a plenary talk I gave at the SIAM Geoscience meeting this (northern) summer.
In the article, I make the argument that the current grand challenge of our discipline, a global circulation model for the mantle and plate tectonic system, is the first ingredient that is needed to extend the success of plate tectonics to encompass the geology of the continents. In the light of the award this week of the Gordon Bell Prize to a team working on exactly this kind of global circulation model (Rudi et al, 2015), we should now set our sights on this next challenge. A key aspect of this is, in my view, linking the large-scale circulation with the typical observables used by geologists to understand the long record of Earth’s evolution which resides in the continental record. One obvious example is the connection between internal dynamics, surface topography and the sedimentary record. This is now a well established field, but the challenge of interpreting large datasets, re-assembling the trajectory of the information through time across the globe, and dealing with the lack of uniqueness of these data as constraints is one that will keep us entertained for at least a decade.
What follows is a précis of an early, informal draft of the SIAM article with the maps I made to illustrate my point.
(I promise to add the source code for the maps to GITHUB !)
Computational Plate Tectonics and the Geological Record in the Continents
Earth Scientists recently celebrated the fifty year anniversary of the theory of Plate Tectonics. The notion that the Earth’s surface is composed of a small number of slowly, but continually, moving ‘rigid’ plates floating on a convecting, fluid interior is now firmly established as the foundation concept of the discipline. Thanks to space geodesy, those motions are now routinely observable and I have illustrated them in the map in Figure 1. In that map, I have also plotted the second invariant of the strain-rate which is clearly vanishingly small in the plate interiors and large at the plate boundaries. If the plates can be considered rigid then they are merely boundary conditions on a global circulation problem.
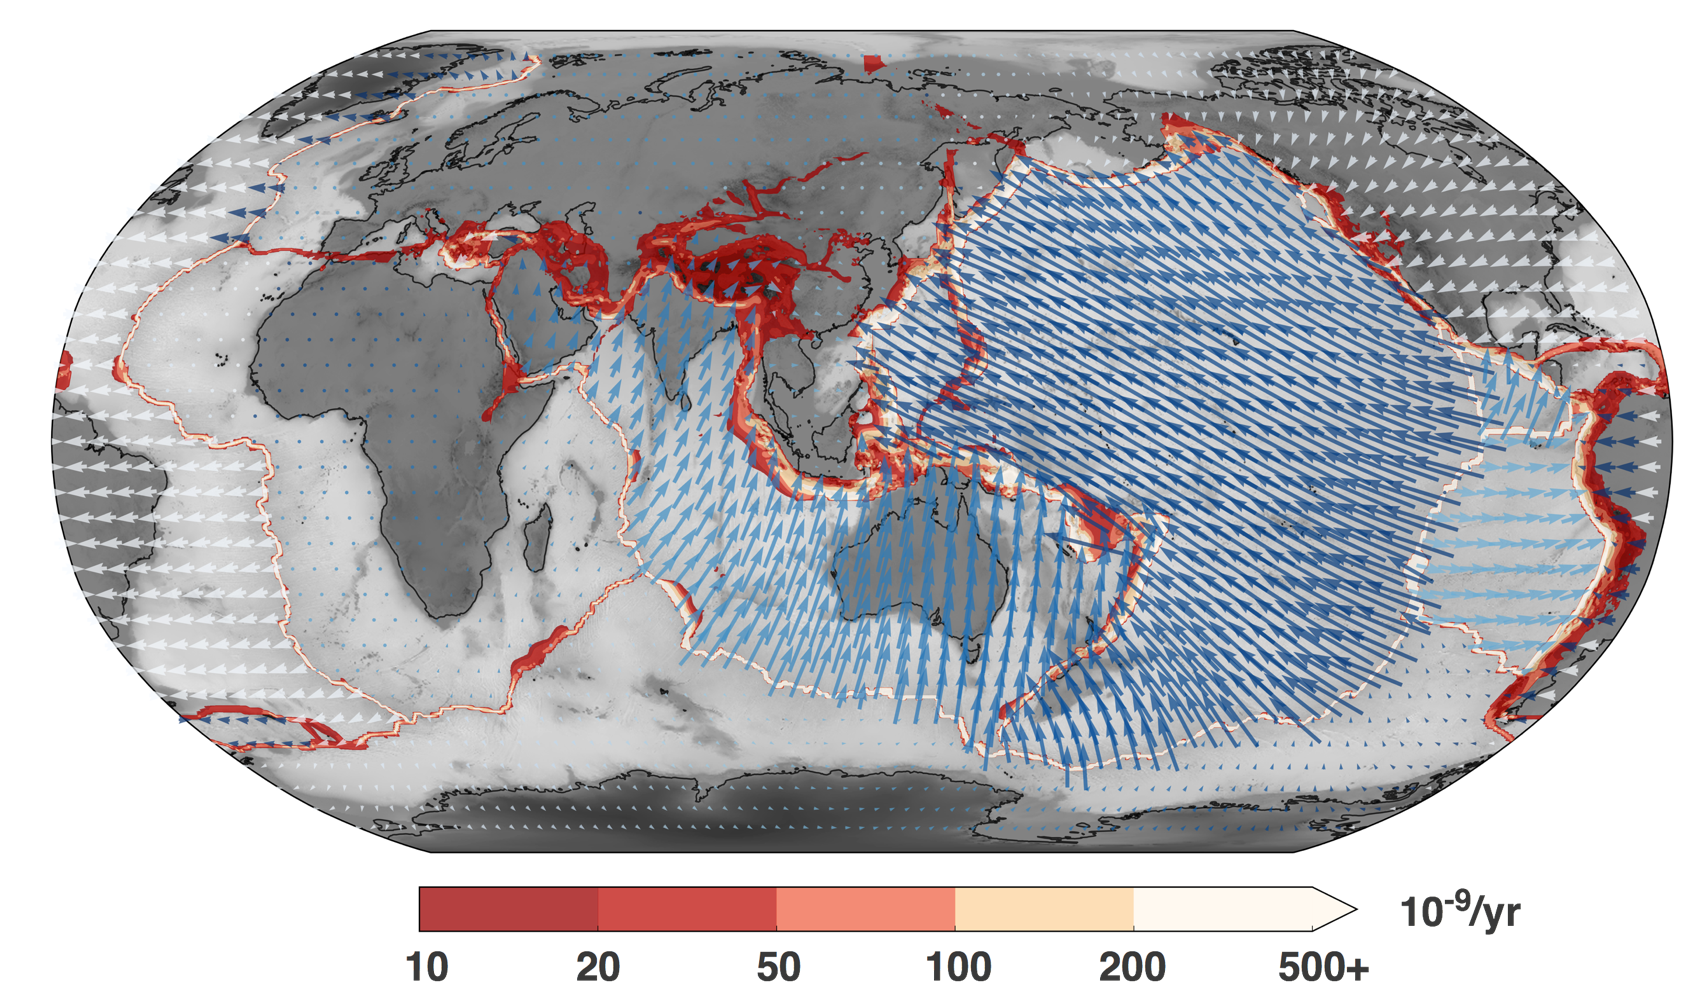
In Figure 1, I have deliberately chosen contours of the strain rate to show that there are some regions where the plate boundaries are relatively diffuse (which is the same thing as saying that there are places where the plates are not rigid). Many of these occur in the continents - particularly obvious is the regional deformation associated with the collision of India and Eurasia which produces the Himalayan mountain belt. The realization that the plates are not rigid is the first step towards one of the most enduring and significant challenge facing the Earth Sciences, namely, a coupled model of deep circulation, plate motions and continental deformation.
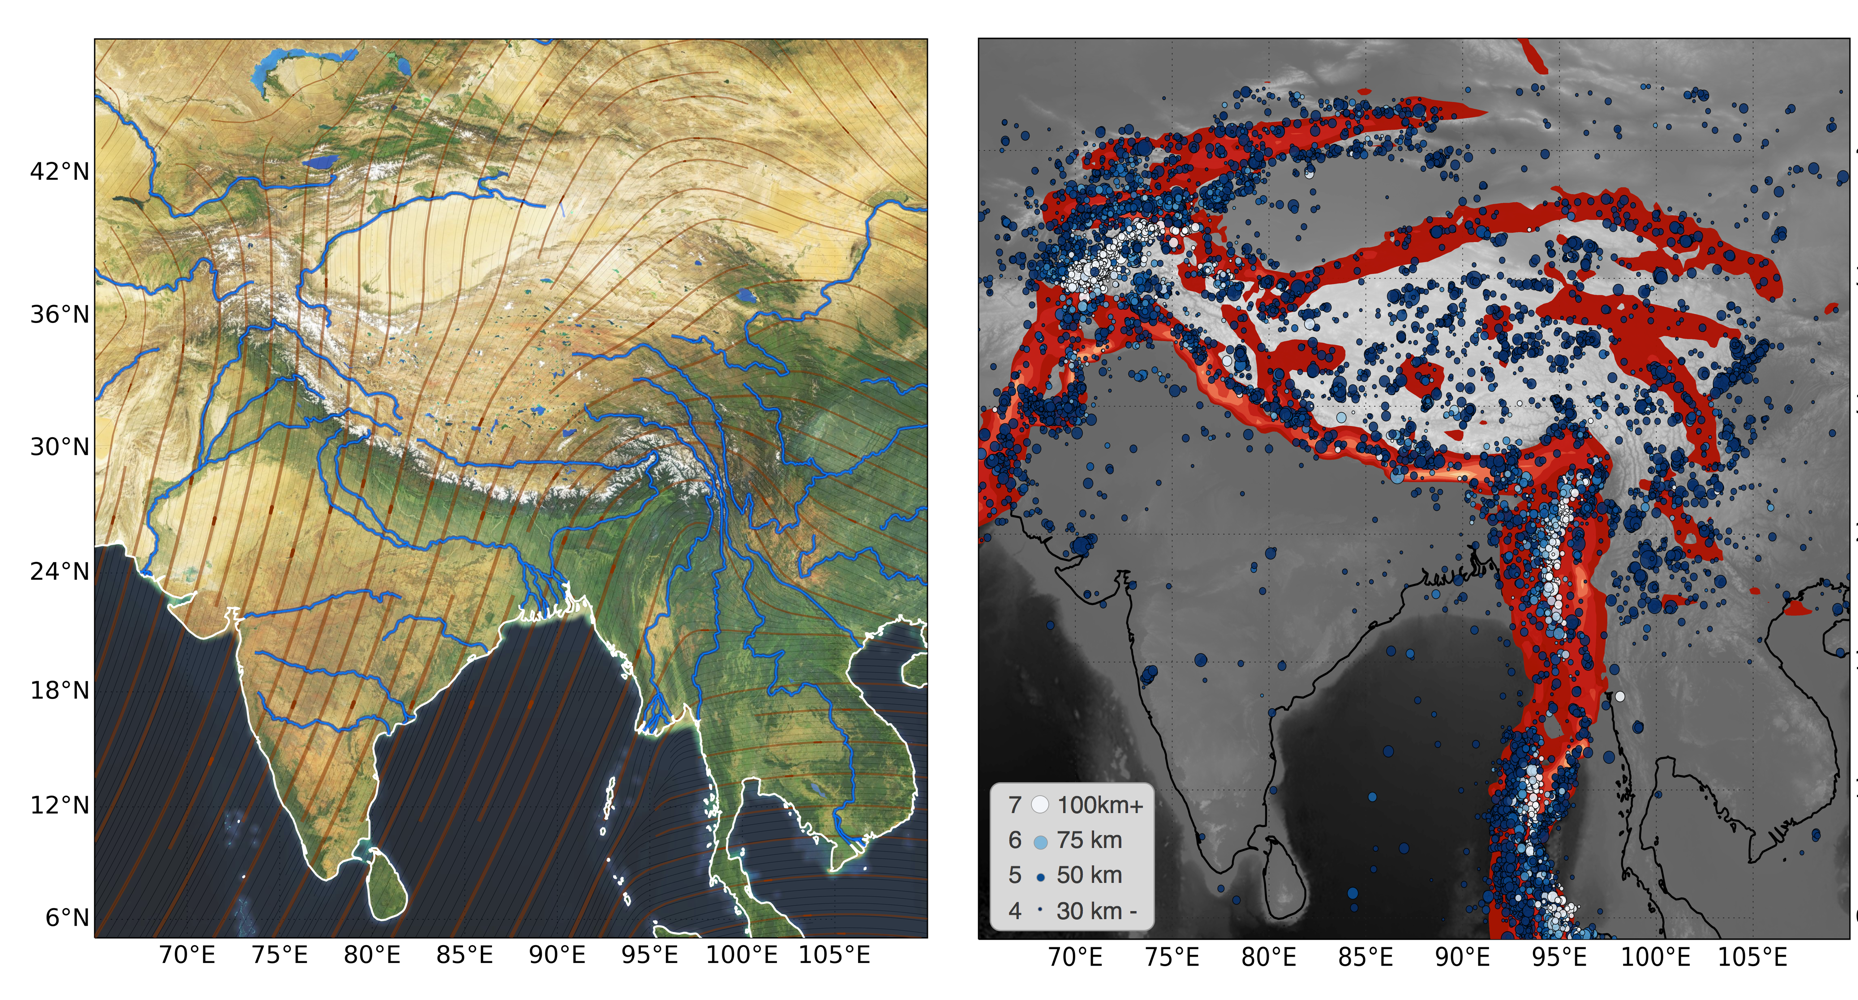
There are two reasons why a global circulation model for the solid Earth is a grand challenge problem. The first is that rheology is very non-linear and history dependent (because it actually represents processes which occur at a much smaller temporal and spatial scale than the plates). Such processes include the mechanics of formation and slip on faults through the accumulated effect of thousands of small earthquakes (see Figure 2), and the effects of grain-scale deformation and melting of the minerals from which the rocks are constituted.
The second aspect of the grand challenge is how we go about finding and using observations which can constrain the many additional degrees of freedom that large-scale, dynamic circulation models require. To appreciate the scale of this challenge requires a recognition of the fundamental difference between the geological record of the ocean floor (the plates) and the geological record of the continental crust. The oceanic crust is actually part of the three-dimensional, deep circulation pattern of the solid Earth. The overturn time of this circulation is of the order of 100 million years and this is comparable to the median age of the oceanic plates. The continental crust is buoyant enough to escape large-scale recycling and is much more widely distributed in age (ranging up to 3+ billion years). The continental record may be longer, but it is an indirect record.
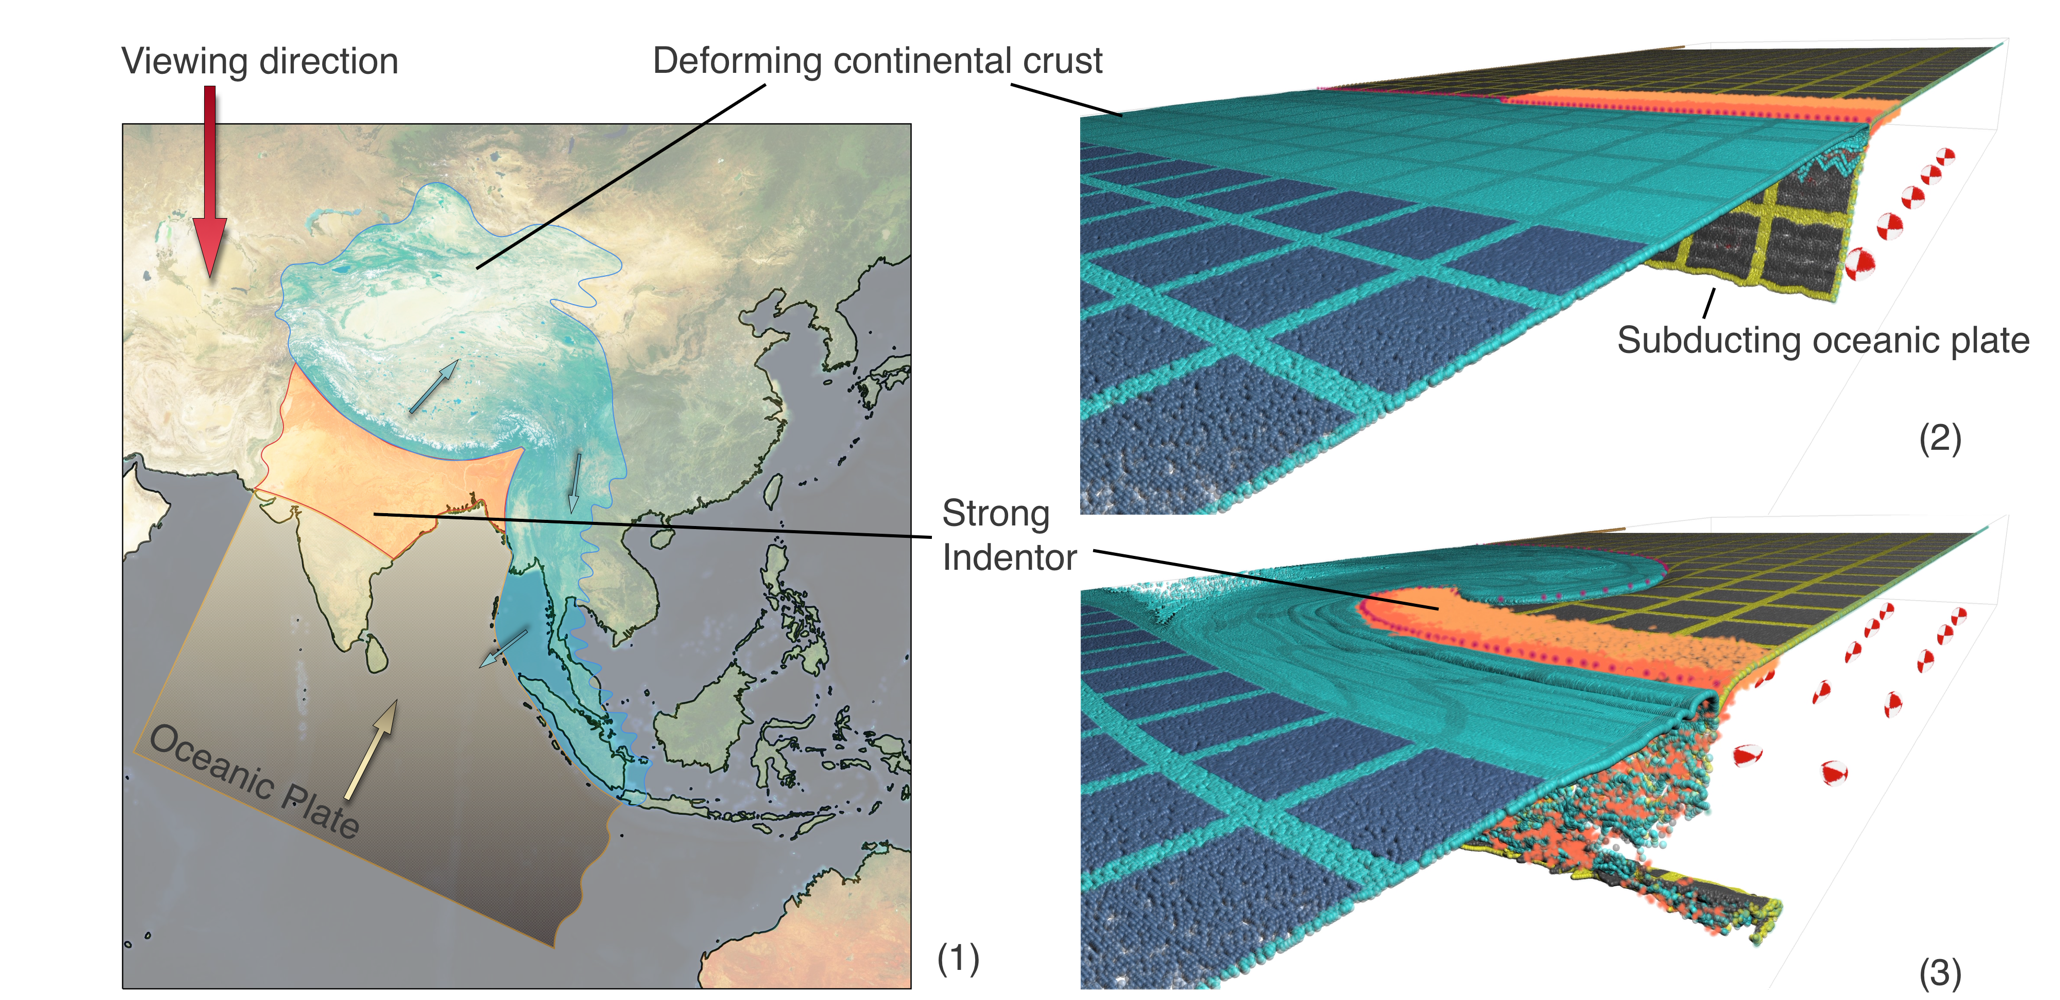
Consider, for example, the Himalayan mountain belt. This is the result of the congestion of a subduction zone by the buoyant and deformable continental crust. The rocks record the history of that collision in the crumpled and overturned units. The deformation also results in the dramatic topography of the region as the crust is shortened and thickened (See Figure 3). The history of the uplifted surface can be inferred by examining the stratigraphy, cooling history, and metamorphism of the rocks. It is also indirectly recorded in the sedimentary record as rivers and glaciers carry material away from the mountain belts and into sedimentary basins.
Sedimentary basins are to geologists what rubbish tips are to archeologists: places where the accumulated detritus of an age is safely stashed away, roughly in order from youngest at the top to oldest at the bottom. The difficulty in inverting such a signal to tell us about the history of geological deformation is that the transport of eroded sediment can occur over long distances, is very dependent on the history of the topography, can be very variable in time and space, is sensitive to very small-scale processes and is coupled to the large scale deformation. This is immediately obvious looking at a map of the major rivers which drain the himalayas (Figure 2). The lengthy, tortuous pathways they often take to reach the ocean are very obviously influenced by changes to the topography occurring as the streams and rivers cut their channels. For discussion of the computational and mathematical challenges in coupling global circulation models of the solid Earth with the erosion, transport and deposition of sediment.
Discussion
Global circulation models for the solid Earth are needed to bring the power of plate tectonic theory to the continental geological record. However, to make these models meaningful, they will have to embed models which can reproduce observable aspects of that continental record. That this is a grand challenge problem is amply illustrated by considering just one of those observables: the effect of weather at the surface in driving erosion and transport of sediment.
Acknowledgements
The maps were produced using the cartopy plotting package (Met Office, 2010) with data from the following sources: Global topography and bathymetry from ETOPO1 (Amante & Eakins, 2009), Plate motions and strain rates from the global strain rate project (Kreemer et al, 2003), Satellite images from Mapbox (mapbox.com), Seismic data were sourced using the obspy package (Beyreuther et al, 2010).
Further Reading
Many of the papers which first described the theory of plate tectonics are extremely accessible. Wilson’s 1963 paper on continental drift and Heirtzler’s 1968 paper on sea-floor spreading bracket the period of the major discoveries.
Moresi et al, (2000) is a review of computational plate tectonics written for a broad audience which describes the methods discussed here with examples. Stadler et al (2010) talk about applications of adaptive mesh refinement to a solid Earth global circulation model with emergent plate boundaries. More background on Figure 3 and the movie can be found in Moresi et al, (2014).
To learn more about the large-scale interaction between mantle circulation and the surface processes of erosion, sediment transport and deposition, see the review paper by Braun (2010).
References
Amante, C. and B.W. Eakins, 2009. ETOPO1 1 Arc-Minute Global Relief Model: Procedures, Data Sources and Analysis. NOAA Technical Memorandum NESDIS NGDC-24. National Geophysical Data Center, NOAA. doi:10.7289/V5C8276M ( accessed - 2015.10.30 ).
Beyreuther, M., R. Barsch, L. Krischer, T. Megies, Y. Behr, and J. Wassermann (2010), ObsPy: A Python Toolbox for Seismology, Seismological Research Letters, 81(3), 530–533, doi:10.1785/gssrl.81.3.530.
Braun, J. (2010), The many surface expressions of mantle dynamics, Nature Geoscience, 3(12), 825–833, doi:10.1038/ngeo1020.
Heirtzler, J. R. (1968), Sea-Floor Spreading, Scientific American, ?, 60–70.
Kreemer, C., W. E. Holt, and A. J. Haines (2003), An integrated global model of present-day plate motions and plate boundary deformation, Geophysical Journal International, 154, 8–34.
Met Office (2010), Cartopy: a cartographic python library with a matplotlib interface, Exeter, Devon.
Moresi, L. N., M. Gurnis, S. Zhong, and S. J. Zhong (2000), Plate tectonics and convection in the Earth’s mantle: Toward a numerical simulation, Computing in Science & Engineering
Moresi, L. N., S. Quenette, V. Lemiale, C. Mériaux, B. Appelbe, and H. B. Muhlhaus (2007), Computational approaches to studying non-linear dynamics of the crust and mantle, Physics of the Earth and Planetary Interiors, 163(1-4), 69–82, doi:10.1016/j.pepi.2007.06.009.
Moresi, L. N., P. G. Betts, M. S. Miller, and R. A. Cayley (2014), Dynamics of continental accretion, Nature, 508(7495), 245–248, doi:10.1038/nature13033.
Rudi, J., O. Ghattas, A. C. I. Malossi, T. Isaac, G. Stadler, M. Gurnis, P. W. J. Staar, Y. Ineichen, C. Bekas, and A. Curioni (2015), An extreme-scale implicit solver for complex PDEs, pp. 1–12, ACM Press, New York, New York, USA.
Stadler, G., M. Gurnis, C. Burstedde, L. C. Wilcox, L. Alisic, and O. Ghattas (2010), The Dynamics of Plate Tectonics and Mantle Flow: From Local to Global Scales, Science, 329(5995), 1033–1038.
Wilson, J. T. (1963), Continental drift, Scientific American, 208(4), 86–100.